MapIndex
MapIndex in numbers
Who maps what, where and when: a portrait of the community-made maps you can find on MapIndex.
Updated
Every map on MapIndex was made by someone who cared about a place: a cycling club planning its season, a family’s road trip, a neighbourhood listing its defibrillators. Together they draw an unexpected picture of what people find worth mapping. These are its numbers.
2,883,927maps you can search
6,255,299maps found
46% of all maps found are shown
- 16,932,635,616coordinate pairs
- 141,884,464lines and areas drawn
- 90,959,187,698My Maps views
Found and shown
MapIndex has found more than 6 million maps, yet shows fewer than half of them. Search should lead to maps worth opening, so a map is only shown when it says what it is about and holds something to look at. The largest group is nearly empty: a single pin dropped to try the tool, or a map started and never filled. Many have gone offline since someone shared their link, deleted by their authors or made private. Others carry only the default name, such as “Untitled map”, and too few named places to tell what they show. Some are tests and advertising. MapIndex looks at every map again from time to time, so a map that is filled, named or published again later appears in search.
Where maps are found
Nobody keeps a list of all the maps people make. MapIndex follows the links people leave behind. Most come from the web’s memory: the Wayback Machine and Common Crawl have archived billions of web pages, and every page that once linked a map still leads to it. uMap is open, so its servers can be asked for every public map directly. Hundreds of thousands of maps were found through short links, rescued by the URLTeam archivists before the services that made them shut down. Then come the places where people talk: Reddit, Wikipedia, Telegram, YouTube and X. Many maps were found more than once, but most of them by a single source alone.
Two kinds of maps
The maps on MapIndex come from two services. Google My Maps is the one most people know: easy to start, made for a handful of pins. uMap is built on OpenStreetMap and loved by people who map in earnest. Google My Maps has three quarters of the maps, yet uMap maps hold two thirds of everything drawn: a uMap map has six times as many objects on average.
- Google My Maps
- OpenStreetMap uMap
Show the numbers
| Measure | Google My Maps | OpenStreetMap uMap |
|---|---|---|
| Maps | 2,168,054 | 715,873 |
| Objects | 132,168,197 | 257,305,223 |
| Coordinate pairs | 4,884,935,289 | 12,047,700,327 |
On Google My Maps, people mostly drop pins. On uMap, half of all objects are lines and areas: routes, districts, flood zones, bike lanes.
- Points
- Lines
- Areas
Show the numbers
| Provider | Points | Lines | Areas |
|---|---|---|---|
| Google My Maps | 115,942,873 | 8,954,027 | 7,346,179 |
| OpenStreetMap uMap | 131,720,965 | 63,501,375 | 62,082,883 |
Where in the world
Maps reach into 250 countries and territories: 5,103 into Antarctica, and 1,891 into the Vatican, more than twice as many as it has residents. Counted where most of its objects lie, nearly every map belongs to one country. The United States leads, just ahead of France: uMap was born in the French OpenStreetMap community, and French schools, towns and associations use it widely.
- 1 to 99
- 100 to 999
- 1,000 to 9,999
- 10,000 to 99,999
- 100,000 or more
- None
Show the numbers
| Country | Maps | Maps reaching into it |
|---|---|---|
| United States | 464,596 | 519,350 |
| France | 428,714 | 520,009 |
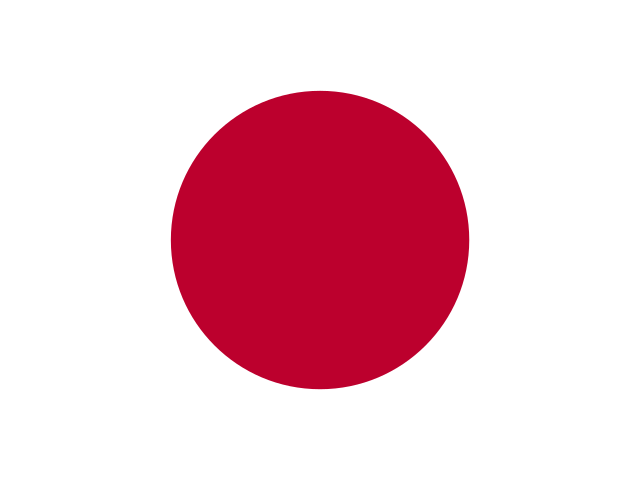
| Japan | 304,263 | 334,377 |
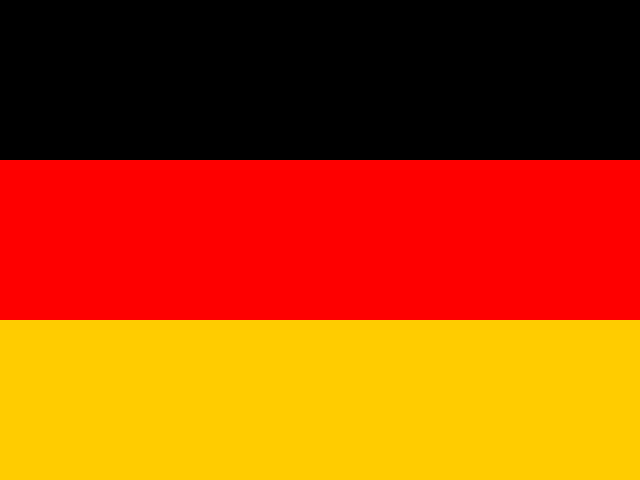
| Germany | 181,465 | 282,506 |
| Spain | 147,056 | 218,913 |
| Italy | 134,404 | 218,523 |
| United Kingdom | 131,009 | 201,761 |
| Canada | 72,806 | 131,227 |
| Australia | 45,547 | 80,377 |
| Brazil | 44,517 | 79,479 |
| Poland | 43,440 | 92,768 |
| Russian Federation | 38,781 | 78,788 |
| Netherlands | 36,017 | 92,385 |
| Belgium | 35,347 | 104,355 |
| Argentina | 29,296 | 56,413 |
| Taiwan | 28,305 | 42,084 |
| Mexico | 27,289 | 65,281 |
| Greece | 26,431 | 61,563 |
| Switzerland | 26,333 | 98,447 |
| Portugal | 24,564 | 62,560 |
| Thailand | 24,062 | 49,869 |
| Austria | 23,843 | 81,484 |
| India | 23,468 | 58,740 |
| Czechia | 20,388 | 60,402 |
| Türkiye | 18,968 | 57,878 |
| Ukraine | 18,626 | 42,733 |
| Sweden | 17,597 | 54,432 |
| Hungary | 17,350 | 50,511 |
| Indonesia | 16,329 | 39,014 |
| Norway | 16,023 | 44,856 |
| China | 15,586 | 53,343 |
| Denmark | 14,052 | 47,156 |
| Colombia | 13,529 | 36,272 |
| Ireland | 13,282 | 42,792 |
| Vietnam | 12,908 | 32,012 |
| New Zealand | 12,827 | 31,033 |
| Croatia | 12,044 | 41,618 |
| Finland | 10,665 | 36,107 |
| Chile | 10,402 | 35,165 |
| Morocco | 10,173 | 34,247 |
| Peru | 9,987 | 33,532 |
| Hong Kong | 9,617 | 24,787 |
| Iceland | 8,805 | 21,973 |
| Romania | 8,420 | 36,470 |
| Malaysia | 8,349 | 28,677 |
| South Africa | 8,041 | 32,249 |
| Philippines | 7,340 | 21,451 |
| Slovakia | 7,157 | 32,042 |
| South Korea | 6,997 | 25,731 |
| Slovenia | 6,483 | 31,172 |
| Israel | 5,619 | 24,182 |
| Bulgaria | 5,382 | 27,735 |
| Singapore | 5,175 | 22,085 |
| United Arab Emirates | 4,690 | 19,951 |
| Lithuania | 4,615 | 22,129 |
| Egypt | 4,596 | 29,037 |
| Costa Rica | 4,536 | 17,086 |
| Ecuador | 4,502 | 19,970 |
| Estonia | 4,419 | 20,331 |
| Sri Lanka | 4,229 | 13,737 |
| Iran | 4,210 | 22,324 |
| Georgia | 4,125 | 17,321 |
| Nepal | 4,023 | 16,637 |
| Latvia | 3,729 | 19,965 |
| Kenya | 3,578 | 19,264 |
| Tanzania | 3,424 | 16,250 |
| Belarus | 3,274 | 17,120 |
| Serbia | 3,159 | 23,661 |
| Luxembourg | 3,045 | 25,095 |
| Syria | 2,975 | 16,548 |
| Bolivia | 2,872 | 19,096 |
| Uruguay | 2,850 | 14,980 |
| Cambodia | 2,831 | 17,689 |
| Uganda | 2,673 | 12,542 |
| Cyprus | 2,641 | 12,936 |
| Albania | 2,520 | 14,722 |
| Senegal | 2,471 | 12,966 |
| Pakistan | 2,388 | 19,037 |
| Malta | 2,376 | 11,704 |
| Guatemala | 2,373 | 13,973 |
| Réunion | 2,360 | 13,375 |
| Kazakhstan | 2,357 | 18,483 |
| Myanmar | 2,313 | 15,500 |
| Jordan | 2,216 | 15,232 |
| Tunisia | 2,201 | 17,051 |
| Bosnia and Herzegovina | 2,106 | 17,331 |
| Saudi Arabia | 2,059 | 17,475 |
| Cuba | 2,043 | 12,112 |
| Montenegro | 2,043 | 12,882 |
| Côte d'Ivoire | 1,987 | 9,819 |
| Namibia | 1,985 | 10,992 |
| Algeria | 1,893 | 19,303 |
| Madagascar | 1,877 | 10,614 |
| Laos | 1,664 | 12,714 |
| Venezuela | 1,616 | 15,379 |
| Mongolia | 1,535 | 11,482 |
| Congo, The Democratic Republic of the | 1,519 | 13,265 |
| Armenia | 1,472 | 9,639 |
| Dominican Republic | 1,447 | 11,225 |
| Puerto Rico | 1,413 | 11,557 |
| Burkina Faso | 1,397 | 8,891 |
| French Polynesia | 1,369 | 6,740 |
| Oman | 1,340 | 10,645 |
| Panama | 1,283 | 13,797 |
| Iraq | 1,262 | 14,656 |
| Afghanistan | 1,255 | 11,193 |
| Bangladesh | 1,247 | 11,532 |
| Ethiopia | 1,242 | 13,280 |
| Uzbekistan | 1,231 | 11,730 |
| Kyrgyzstan | 1,230 | 8,999 |
| Nicaragua | 1,192 | 9,952 |
| North Macedonia | 1,121 | 12,577 |
| Mali | 1,102 | 11,996 |
| Nigeria | 1,079 | 14,282 |
| Guadeloupe | 1,022 | 10,109 |
| Benin | 947 | 7,072 |
| Mauritius | 921 | 6,022 |
| Haiti | 915 | 7,473 |
| Paraguay | 912 | 10,995 |
| Lebanon | 875 | 11,329 |
| Azerbaijan | 861 | 10,565 |
| Maldives | 825 | 3,602 |
| Rwanda | 823 | 7,188 |
| Cameroon | 818 | 9,826 |
| Botswana | 815 | 8,818 |
| Moldova | 810 | 8,721 |
| Niger | 768 | 9,467 |
| Martinique | 767 | 10,029 |
| Togo | 759 | 5,984 |
| Antarctica | 748 | 5,107 |
| Palestine, State of | 729 | 8,973 |
| Honduras | 681 | 10,066 |
| Andorra | 676 | 7,457 |
| Libya | 673 | 12,304 |
| Bhutan | 654 | 5,152 |
| Bahamas | 642 | 7,276 |
| El Salvador | 620 | 7,603 |
| French Guiana | 618 | 9,616 |
| Greenland | 605 | 6,279 |
| Tajikistan | 598 | 6,502 |
| New Caledonia | 589 | 5,513 |
| Ghana | 584 | 10,775 |
| Belize | 560 | 5,783 |
| Faroe Islands | 534 | 3,215 |
| Seychelles | 533 | 3,470 |
| Guinea | 532 | 6,308 |
| Macao | 517 | 3,913 |
| Cabo Verde | 502 | 3,792 |
| Mozambique | 469 | 9,048 |
| Jamaica | 461 | 6,654 |
| Angola | 442 | 7,566 |
| Qatar | 424 | 7,123 |
| Sudan | 423 | 10,921 |
| Zimbabwe | 418 | 9,079 |
| Zambia | 416 | 8,875 |
| Aruba | 400 | 2,714 |
| Barbados | 378 | 3,865 |
| Svalbard and Jan Mayen | 377 | 2,858 |
| Monaco | 375 | 11,875 |
| Papua New Guinea | 369 | 5,787 |
| Antigua and Barbuda | 362 | 3,150 |
| Trinidad and Tobago | 345 | 4,694 |
| XK | 344 | 6,927 |
| Mauritania | 331 | 9,079 |
| Fiji | 319 | 4,426 |
| Yemen | 318 | 7,422 |
| Somalia | 310 | 7,124 |
| Virgin Islands, U.S. | 307 | 3,911 |
| Malawi | 304 | 5,484 |
| Lesotho | 282 | 3,492 |
| Mayotte | 269 | 4,737 |
| Guam | 260 | 3,115 |
| Bahrain | 250 | 4,250 |
| Chad | 246 | 7,969 |
| Djibouti | 238 | 3,558 |
| Curaçao | 229 | 2,766 |
| Congo | 216 | 6,548 |
| South Sudan | 212 | 5,953 |
| Gabon | 208 | 5,461 |
| North Korea | 205 | 5,209 |
| Virgin Islands, British | 198 | 2,173 |
| Central African Republic | 196 | 5,486 |
| Turkmenistan | 192 | 7,379 |
| Saint Lucia | 189 | 3,510 |
| Guyana | 186 | 5,692 |
| Burundi | 179 | 3,499 |
| Kuwait | 170 | 5,454 |
| Saint Vincent and the Grenadines | 166 | 2,708 |
| Vanuatu | 166 | 2,899 |
| Åland Islands | 164 | 2,253 |
| Isle of Man | 162 | 3,478 |
| Jersey | 157 | 3,404 |
| Guernsey | 151 | 3,229 |
| Samoa | 151 | 1,793 |
| Brunei Darussalam | 149 | 3,197 |
| Bonaire, Sint Eustatius and Saba | 143 | 1,805 |
| Grenada | 143 | 2,995 |
| Timor-Leste | 143 | 2,549 |
| Saint Martin (French part) | 142 | 2,732 |
| Gambia | 140 | 3,634 |
| Sierra Leone | 136 | 4,829 |
| Bermuda | 135 | 2,693 |
| San Marino | 121 | 3,443 |
| Dominica | 108 | 3,342 |
| Cayman Islands | 104 | 2,454 |
| Suriname | 103 | 5,406 |
| Solomon Islands | 98 | 2,366 |
| Liechtenstein | 94 | 4,909 |
| Turks and Caicos Islands | 94 | 1,680 |
| Saint Barthélemy | 86 | 1,890 |
| Guinea-Bissau | 86 | 2,959 |
| Cook Islands | 78 | 1,627 |
| Tonga | 78 | 1,879 |
| Eritrea | 77 | 3,351 |
| French Southern Territories | 74 | 1,271 |
| Saint Kitts and Nevis | 73 | 2,452 |
| Sao Tome and Principe | 73 | 1,768 |
| Northern Mariana Islands | 72 | 1,603 |
| Gibraltar | 70 | 2,781 |
| Micronesia, Federated States of | 69 | 1,423 |
| Liberia | 67 | 4,559 |
| Palau | 67 | 1,651 |
| Sint Maarten (Dutch part) | 64 | 2,378 |
| Anguilla | 62 | 1,421 |
| Eswatini | 60 | 3,298 |
| Falkland Islands (Malvinas) | 58 | 1,706 |
| Comoros | 56 | 2,045 |
| Saint Helena, Ascension and Tristan da Cunha | 52 | 1,374 |
| South Georgia and the South Sandwich Islands | 49 | 1,005 |
| American Samoa | 45 | 1,431 |
| Saint Pierre and Miquelon | 41 | 1,652 |
| United States Minor Outlying Islands | 37 | 870 |
| Equatorial Guinea | 33 | 2,478 |
| Kiribati | 30 | 1,148 |
| Norfolk Island | 29 | 779 |
| Marshall Islands | 18 | 1,276 |
| Wallis and Futuna | 18 | 1,182 |
| Western Sahara | 15 | 2,467 |
| Montserrat | 14 | 1,224 |
| Nauru | 14 | 998 |
| British Indian Ocean Territory | 10 | 770 |
| Niue | 10 | 892 |
| Christmas Island | 8 | 782 |
| Tuvalu | 7 | 774 |
| Pitcairn | 6 | 764 |
| Cocos (Keeling) Islands | 3 | 651 |
| Heard Island and McDonald Islands | 3 | 523 |
| Tokelau | 1 | 171 |
| Bouvet Island | 0 | 325 |
| Holy See (Vatican City State) | 0 | 1,891 |
Drawn object by object, the world lights up where people live and travel. Western Europe is covered almost completely, then come Japan, the eastern United States and the cities of South America.
Few objectsMany

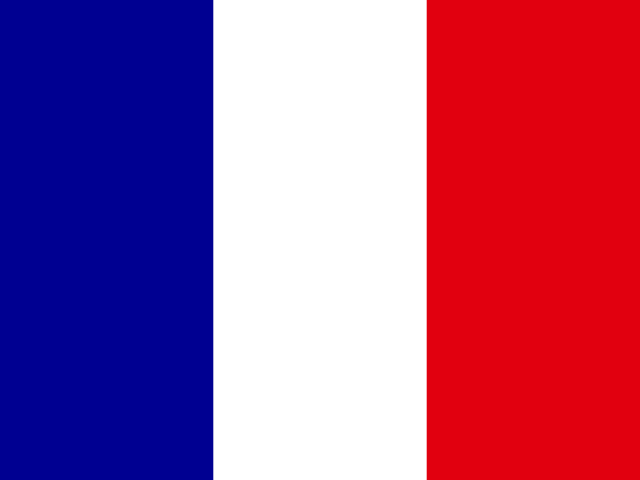
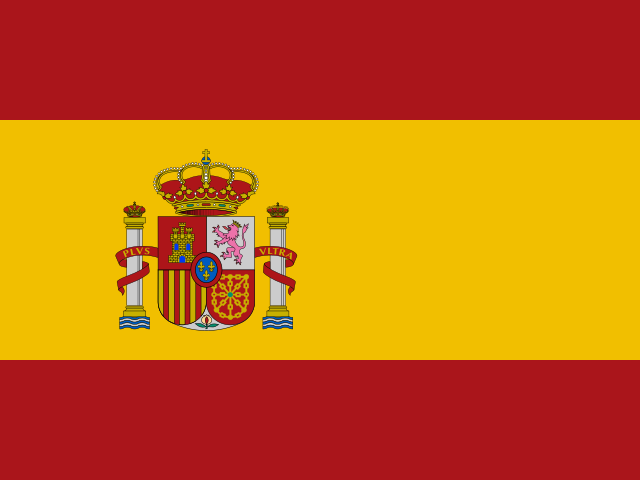
Measured against population, France leads by far with one map for every 156 people, followed by Estonia, Spain, Slovenia and Belgium. Among the most populous countries, Nigeria, Bangladesh and Pakistan have the fewest maps per person: there is much left to map.

Most maps are close to home: more than half fit within one town or valley.
What maps are about
To see what maps are about, MapIndex reads a random sample of maps and lets maps with similar titles and descriptions settle next to each other, wherever on Earth they are. The result is a landscape of its own: every summit is a topic, and the higher the ground, the more maps share it.
Swipe sideways to see the whole landscape.
Ways from A to B dominate. Travel routes, hikes, bike tours, walks, runs, bus lines and train journeys together make up about a quarter of all maps. Then come the places of everyday life: restaurants, schools, shops, clinics, festivals.
Every country has a speciality. Japan maps parking more than twice as often as the world does, Germany and Poland map their railways, Spain its beaches, Taiwan its restaurants. Britain, Belgium and the Netherlands map their walks, and Brazil and Argentina their bus routes, four times as often as the world. In the United States, many maps show properties and developments: plots for sale, new homes, real estate listings.
When maps are made
Until 2023, more maps were made every year than the year before. The years since look quieter, partly because MapIndex finds a map once someone links it, and newer maps have had less time to be linked.
- Google My Maps
- OpenStreetMap uMap
Show the numbers
| Year | Google My Maps | OpenStreetMap uMap |
|---|---|---|
| 2014 | 0 | 7,732 |
| 2015 | 56,103 | 13,619 |
| 2016 | 133,112 | 20,649 |
| 2017 | 127,717 | 30,293 |
| 2018 | 141,842 | 41,994 |
| 2019 | 156,402 | 58,414 |
| 2020 | 152,303 | 69,812 |
| 2021 | 157,817 | 82,379 |
| 2022 | 160,823 | 86,132 |
| 2023 | 165,881 | 100,954 |
| 2024 | 115,562 | 95,459 |
| 2025 | 100,982 | 59,880 |
| 2026 | 94,120 | 45,028 |
Mapping is daytime and weekday work. Counted in the local time of the place a map shows, it starts at around 7 in the morning, peaks in the late morning and again in the afternoon, and fades towards midnight. Weekends are quiet: on Saturdays fewer than half as many maps are started as on a Tuesday, a hint that many maps are made at school, at work or for an association.
Show the numbers
| Day | Maps | Share |
|---|---|---|
| Mon | 345,685 | 16% |
| Tue | 365,535 | 17% |
| Wed | 357,177 | 17% |
| Thu | 350,964 | 17% |
| Fri | 319,515 | 15% |
| Sat | 173,243 | 8.2% |
| Sun | 193,555 | 9.2% |
Over the year, mapping peaks in March, in the middle of school and working terms, and December is the quietest month.
Show the numbers
| Month | Maps | Share |
|---|---|---|
| Jan | 167,932 | 8.2% |
| Feb | 170,714 | 8.3% |
| Mar | 197,773 | 9.6% |
| Apr | 184,546 | 9.0% |
| May | 187,871 | 9.1% |
| Jun | 169,382 | 8.2% |
| Jul | 161,349 | 7.8% |
| Aug | 159,486 | 7.7% |
| Sep | 168,867 | 8.2% |
| Oct | 174,777 | 8.5% |
| Nov | 168,219 | 8.2% |
| Dec | 147,491 | 7.2% |
Maps that live on
Most maps are made in one go: nearly nine in ten were never changed after the day they were made. The others live on, as their authors add places, close roads and move events. One map in 25 was still being changed more than a year after it was made, some of them more than five years later.
How much is on a map
Most maps are small: half of them hold no more than a dozen or so objects. A few are enormous. The largest maps carry hundreds of thousands of objects, mostly infrastructure and environmental data: water networks, cycling segments, slopes, coastal zones.
Show the numbers
| Objects | Google My Maps | OpenStreetMap uMap |
|---|---|---|
| 1 | 92,100 (4.2%) | 37,718 (5.3%) |
| 2 | 75,570 (3.5%) | 24,384 (3.4%) |
| 3 | 180,922 (8.3%) | 37,995 (5.3%) |
| 4 | 115,666 (5.3%) | 28,965 (4.0%) |
| 5 | 114,060 (5.3%) | 30,362 (4.2%) |
| 6–7 | 197,660 (9.1%) | 54,034 (7.5%) |
| 8–9 | 154,818 (7.1%) | 45,058 (6.3%) |
| 10–12 | 199,767 (9.2%) | 54,499 (7.6%) |
| 13–15 | 138,485 (6.4%) | 41,121 (5.7%) |
| 16–19 | 135,267 (6.2%) | 41,350 (5.8%) |
| 20–24 | 125,268 (5.8%) | 37,900 (5.3%) |
| 25–31 | 117,748 (5.4%) | 37,827 (5.3%) |
| 32–39 | 89,551 (4.1%) | 29,171 (4.1%) |
| 40–49 | 75,695 (3.5%) | 25,968 (3.6%) |
| 50–62 | 66,604 (3.1%) | 24,570 (3.4%) |
| 63–78 | 53,312 (2.5%) | 21,554 (3.0%) |
| 79–99 | 46,947 (2.2%) | 19,633 (2.7%) |
| 100–125 | 38,145 (1.8%) | 16,547 (2.3%) |
| 126–157 | 29,946 (1.4%) | 13,575 (1.9%) |
| 158–199 | 24,930 (1.1%) | 12,443 (1.7%) |
| 200–250 | 19,499 (0.9%) | 10,822 (1.5%) |
| 251–315 | 15,333 (0.7%) | 9,606 (1.3%) |
| 316–397 | 12,275 (0.6%) | 8,378 (1.2%) |
| 398–500 | 9,821 (0.5%) | 7,135 (1.0%) |
| 501–630 | 7,884 (0.4%) | 6,377 (0.9%) |
| 631–793 | 6,139 (0.3%) | 5,239 (0.7%) |
| 794–999 | 5,079 (0.2%) | 4,585 (0.6%) |
| 1k–1,258 | 4,489 (0.2%) | 3,997 (0.6%) |
| 1,259–1,584 | 3,402 (0.2%) | 3,870 (0.5%) |
| 1,585–1,994 | 3,109 (0.1%) | 3,146 (0.4%) |
| 1,995–2,511 | 2,715 (0.1%) | 2,738 (0.4%) |
| 2,512–3,161 | 1,478 (<0.1%) | 2,442 (0.3%) |
| 3,162–3,980 | 1,181 (<0.1%) | 2,225 (0.3%) |
| 3,981–5,011 | 988 (<0.1%) | 1,872 (0.3%) |
| 5,012–6,309 | 685 (<0.1%) | 1,515 (0.2%) |
| 6,310–7,942 | 513 (<0.1%) | 1,350 (0.2%) |
| 7,943–9,999 | 412 (<0.1%) | 1,188 (0.2%) |
| 10k–12,588 | 266 (<0.1%) | 1,007 (0.1%) |
| 12,589–15,848 | 163 (<0.1%) | 790 (0.1%) |
| 15,849–19,952 | 112 (<0.1%) | 725 (0.1%) |
| 19,953–25,118 | 30 (<0.1%) | 528 (<0.1%) |
| 25,119–31,622 | 4 (<0.1%) | 513 (<0.1%) |
| 31,623–39,810 | 7 (<0.1%) | 377 (<0.1%) |
| 39,811–50,118 | 5 (<0.1%) | 234 (<0.1%) |
| 50,119–63,095 | 3 (<0.1%) | 170 (<0.1%) |
| 63,096–79,432 | 0 (0%) | 138 (<0.1%) |
| 79,433–99,999 | 1 (<0.1%) | 75 (<0.1%) |
| 100k–125,892 | 0 (0%) | 52 (<0.1%) |
| 125,893–158,488 | 0 (0%) | 34 (<0.1%) |
| 158,489–199,525 | 0 (0%) | 21 (<0.1%) |
| 199,526–251,188 | 0 (0%) | 17 (<0.1%) |
| 251,189–316,227 | 0 (0%) | 10 (<0.1%) |
| 316,228–398,106 | 0 (0%) | 9 (<0.1%) |
| 398,107–501,186 | 0 (0%) | 7 (<0.1%) |
| 501,187–630,956 | 0 (0%) | 2 (<0.1%) |
| 630,957–794,327 | 0 (0%) | 5 (<0.1%) |
| 794,328–999,999 | 0 (0%) | 0 (0%) |
| 1M+ | 0 (0%) | 0 (0%) |
- Infrastructure and Environmental Risks in Barrio Sarmiento and the Matanza-Riachuelo Basin
- Walking, Cycling and Climbing Segments in France
- Road and Terrain Slopes Over 7% in Northern France
- Potential Coastal Functional Areas for Marine and Coastal Birds
- European Places and Administrative Boundaries
Lines are where the largest maps get their size: one map of steep roads in northern France draws more than 600,000 of them.
Copies
Good maps get copied: a teacher hands out a map and every student saves their own, or a town reuses its neighbour’s map of shelters. About one map in twenty shown on MapIndex has near copies, and the most copied ones have hundreds. MapIndex shows each family of copies once in search.
How often maps are viewed
Google My Maps counts how often each map is opened, and these counts follow a steep curve. The typical map has been viewed a few thousand times, while one in a hundred maps gathers more than half of all views. Fifteen maps have passed 100 million views each: transit maps, charging stations and the maps people followed during the pandemic.
Show the numbers
| Views | Google My Maps |
|---|---|
| 0 | 2,719 (0.1%) |
| 1 | 204 (<0.1%) |
| 2 | 171 (<0.1%) |
| 3 | 17,994 (0.8%) |
| 4 | 10,046 (0.5%) |
| 5 | 5,106 (0.2%) |
| 6–7 | 8,228 (0.4%) |
| 8–9 | 4,829 (0.2%) |
| 10–12 | 5,096 (0.2%) |
| 13–15 | 4,230 (0.2%) |
| 16–19 | 8,985 (0.4%) |
| 20–24 | 14,688 (0.7%) |
| 25–31 | 18,021 (0.8%) |
| 32–39 | 19,204 (0.9%) |
| 40–49 | 19,800 (0.9%) |
| 50–62 | 21,210 (1.0%) |
| 63–78 | 22,400 (1.0%) |
| 79–99 | 25,220 (1.2%) |
| 100–125 | 27,407 (1.3%) |
| 126–157 | 29,992 (1.4%) |
| 158–199 | 35,452 (1.6%) |
| 200–250 | 38,453 (1.8%) |
| 251–315 | 45,106 (2.1%) |
| 316–397 | 52,283 (2.4%) |
| 398–500 | 58,222 (2.7%) |
| 501–630 | 64,485 (3.0%) |
| 631–793 | 70,686 (3.3%) |
| 794–999 | 77,012 (3.6%) |
| 1k–1,258 | 81,715 (3.8%) |
| 1,259–1,584 | 85,073 (3.9%) |
| 1,585–1,994 | 87,218 (4.0%) |
| 1,995–2,511 | 88,999 (4.1%) |
| 2,512–3,161 | 88,758 (4.1%) |
| 3,162–3,980 | 88,137 (4.1%) |
| 3,981–5,011 | 86,345 (4.0%) |
| 5,012–6,309 | 83,362 (3.8%) |
| 6,310–7,942 | 79,728 (3.7%) |
| 7,943–9,999 | 76,265 (3.5%) |
| 10k–12,588 | 70,944 (3.3%) |
| 12,589–15,848 | 66,549 (3.1%) |
| 15,849–19,952 | 61,526 (2.8%) |
| 19,953–25,118 | 56,199 (2.6%) |
| 25,119–31,622 | 51,067 (2.4%) |
| 31,623–39,810 | 45,830 (2.1%) |
| 39,811–50,118 | 41,154 (1.9%) |
| 50,119–63,095 | 35,839 (1.7%) |
| 63,096–79,432 | 31,379 (1.4%) |
| 79,433–99,999 | 27,294 (1.3%) |
| 100k–125,892 | 23,212 (1.1%) |
| 125,893–158,488 | 19,842 (0.9%) |
| 158,489–199,525 | 16,616 (0.8%) |
| 199,526–251,188 | 13,542 (0.6%) |
| 251,189–316,227 | 11,284 (0.5%) |
| 316,228–398,106 | 9,254 (0.4%) |
| 398,107–501,186 | 7,454 (0.3%) |
| 501,187–630,956 | 6,050 (0.3%) |
| 630,957–794,327 | 4,766 (0.2%) |
| 794,328–999,999 | 3,641 (0.2%) |
| 1M–1,258,924 | 2,938 (0.1%) |
| 1,258,925–1,584,892 | 2,199 (0.1%) |
| 1,584,893–1,995,261 | 1,735 (<0.1%) |
| 1,995,262–2,511,885 | 1,292 (<0.1%) |
| 2,511,886–3,162,277 | 945 (<0.1%) |
| 3,162,278–3,981,071 | 656 (<0.1%) |
| 3,981,072–5,011,871 | 550 (<0.1%) |
| 5,011,872–6,309,572 | 408 (<0.1%) |
| 6,309,573–7,943,281 | 291 (<0.1%) |
| 7,943,282–9,999,999 | 190 (<0.1%) |
| 10M–12,589,253 | 159 (<0.1%) |
| 12,589,254–15,848,931 | 122 (<0.1%) |
| 15,848,932–19,952,622 | 78 (<0.1%) |
| 19,952,623–25,118,863 | 42 (<0.1%) |
| 25,118,864–31,622,776 | 54 (<0.1%) |
| 31,622,777–39,810,716 | 25 (<0.1%) |
| 39,810,717–50,118,722 | 27 (<0.1%) |
| 50,118,723–63,095,733 | 19 (<0.1%) |
| 63,095,734–79,432,822 | 11 (<0.1%) |
| 79,432,823–99,999,999 | 7 (<0.1%) |
| 100M–125,892,540 | 5 (<0.1%) |
| 125,892,541–158,489,318 | 5 (<0.1%) |
| 158,489,319–199,526,230 | 0 (0%) |
| 199,526,231–251,188,642 | 3 (<0.1%) |
| 251,188,643–316,227,765 | 0 (0%) |
| 316,227,766–398,107,170 | 1 (<0.1%) |
| 398,107,171–501,187,233 | 0 (0%) |
| 501,187,234–630,957,343 | 0 (0%) |
| 630,957,344–794,328,234 | 1 (<0.1%) |
| 794,328,235–999,999,999 | 0 (0%) |
| 1G+ | 0 (0%) |
- Mumbai Metro and Railway Network
- COVID-19 Community Areas and Case Risk in Taiwan
- Global Spread of the Wuhan Coronavirus
- Confirmed Coronavirus Cases and Suspected Locations Worldwide
- VinFast Fast DC Charging Stations in Vietnam
- Brazilian Polling Sections with Zero Bolsonaro Votes in 2022
- Russo-Ukrainian War: Territorial Advances and Combat Lines
- Miramagia Dragon Journey
- Travel Itinerary Across Egypt, China, Turkey and the Eastern Mediterranean
- Reported Bedbug Incidents at Hotels in Japan
About these numbers
Apart from the figures of maps found and shown and of where they are found, every figure counts the maps you can find in MapIndex’s search on the day named at the top, as their providers describe them. A map counts for the country where most of its objects lie. Google My Maps dated maps made before 2016 to its move to the new My Maps, so their dates come from the last time they were saved, and maps last saved before July 2015 have no date at all. Topics are estimated from a random sample, so their shares are close but not exact. Country borders come from Natural Earth, population figures too.
These numbers will be updated from time to time. If you are curious about something they do not show, write to us.